Choosing a college by its 40 year return, not its ranking.
PathWise turns a ten question intake into a personalized college and career report: net price after aid, entry and year ten wages, a 40 year NPV for every school on the list, and an AI narrative that explains the verdict. Built end to end and running as a live prototype.
What was not working
Every spring, students hold three or four offer letters and decide with the wrong inputs: ranking, brand, sticker price, a campus visit. The number that matters, what each path is worth after aid over a working life, is never on the table.
What the user actually needed
The decision is a portfolio question. In state residency, the aid on each letter, the major, the target role and the brand signal of the school all move the outcome, and they move it differently for each school. So the product had to ask for those inputs one at a time, then do the arithmetic the student cannot do in their head.
Every screen, in order
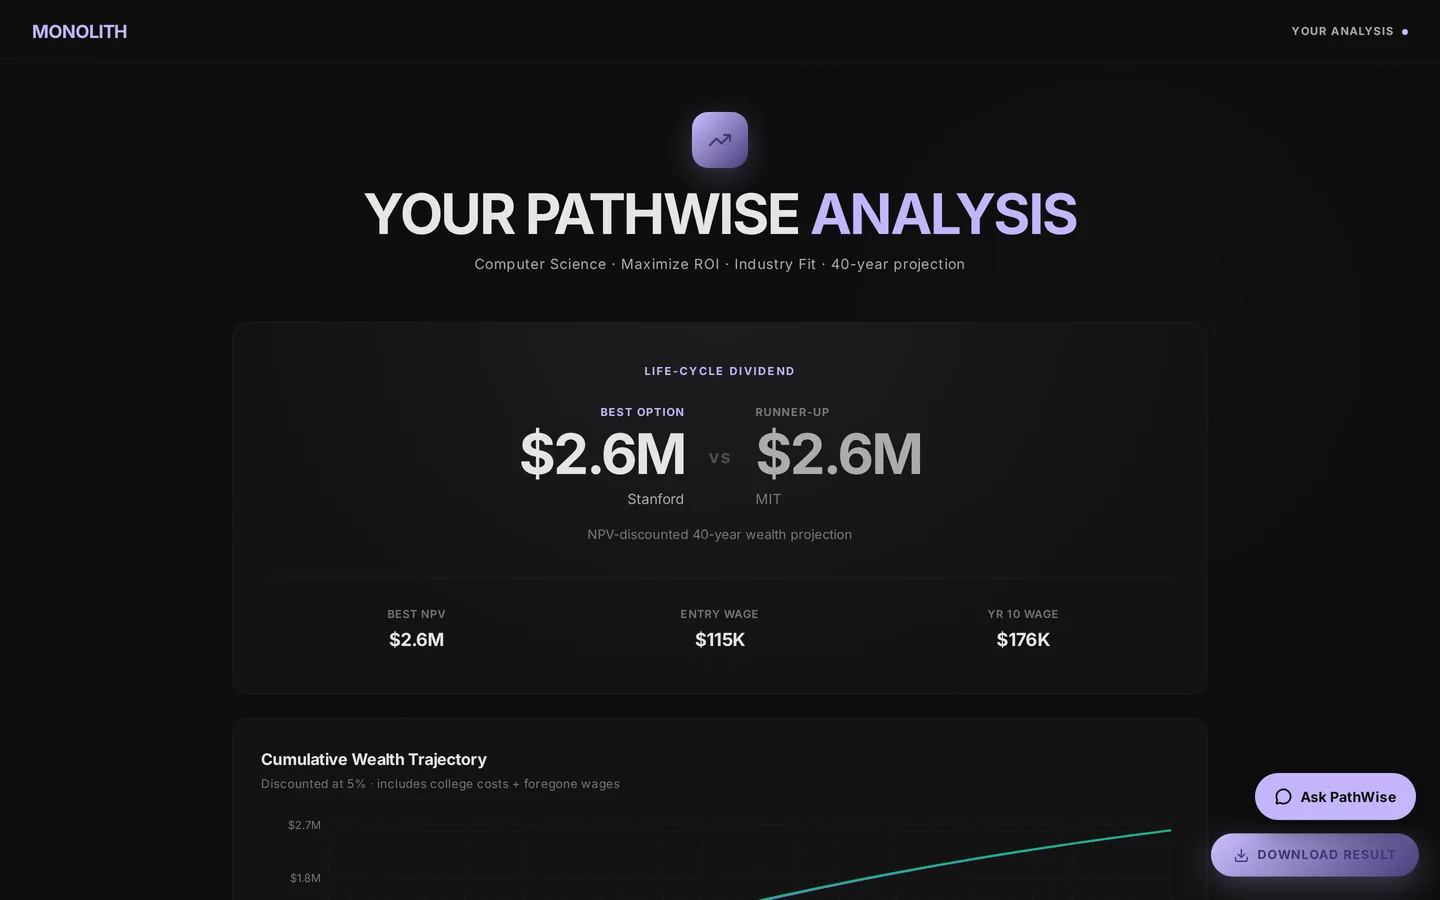
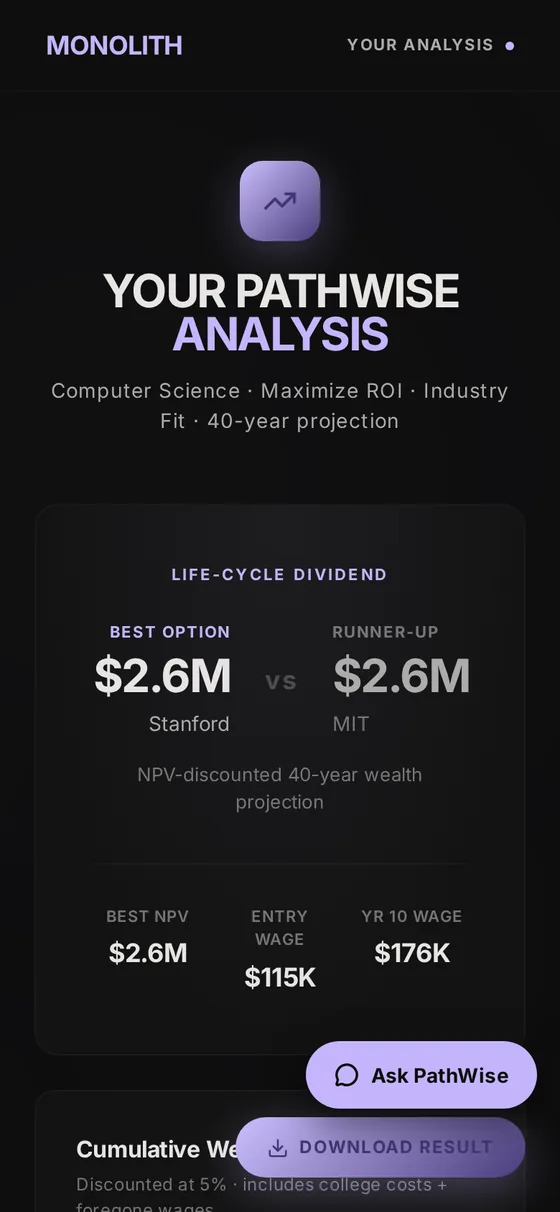
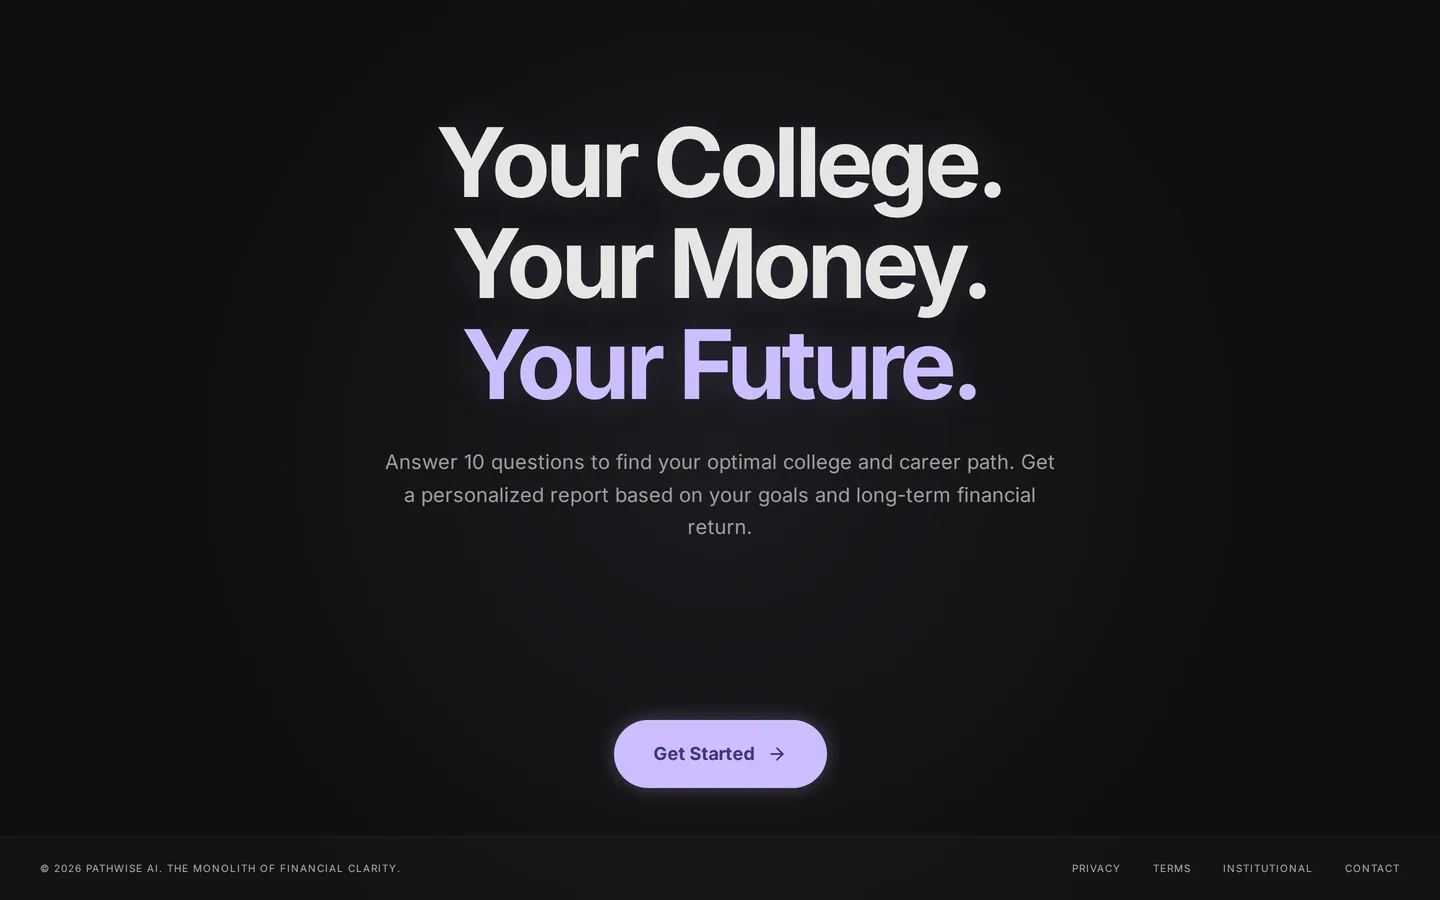
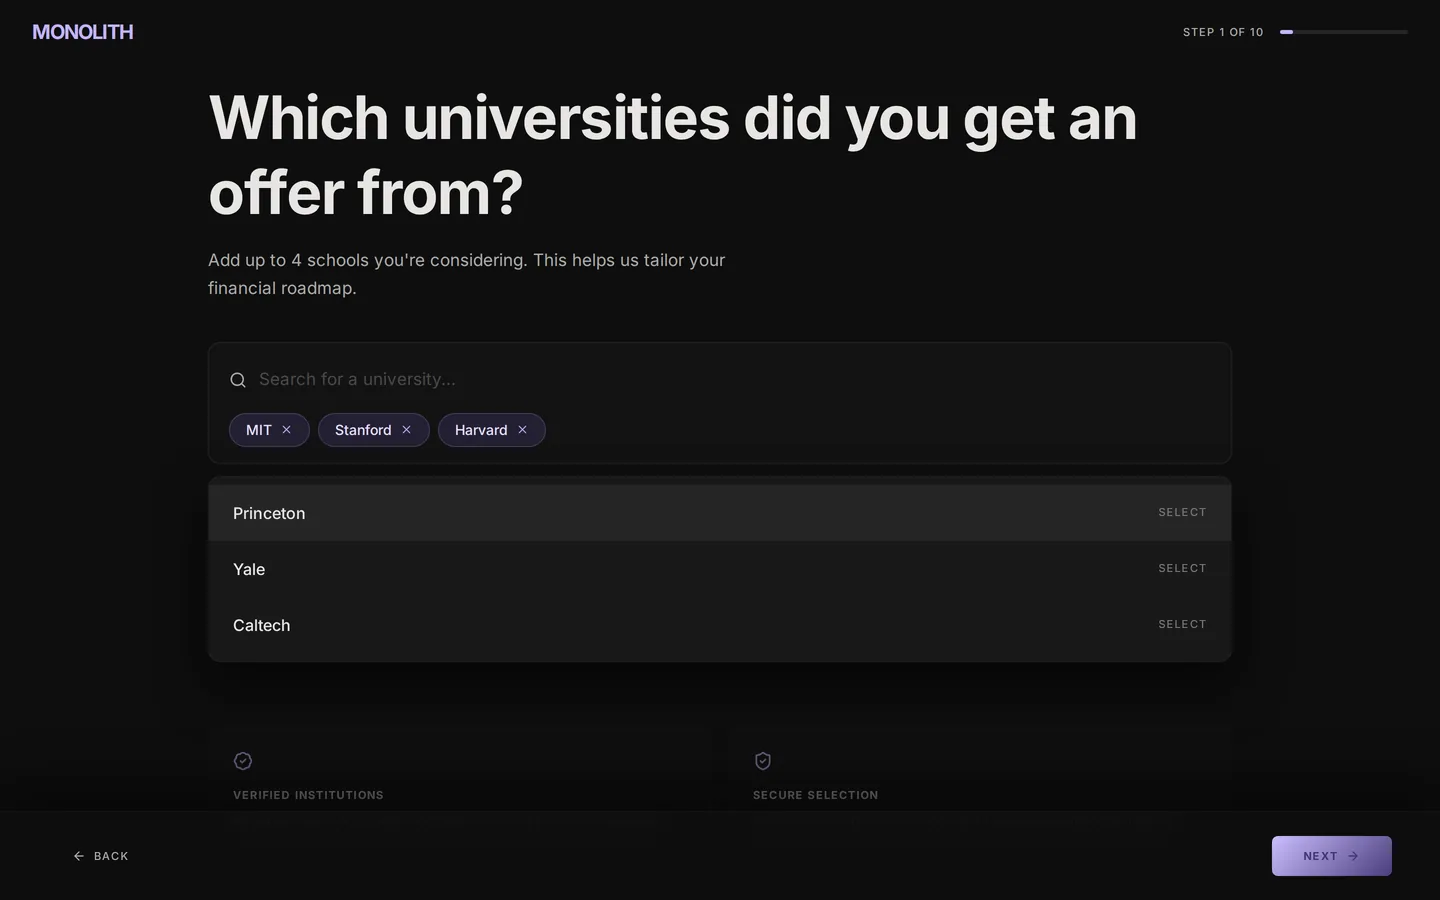
Real screens from the live prototype, captured in one session: three offers, a computer science major, a product manager target, New York residency.
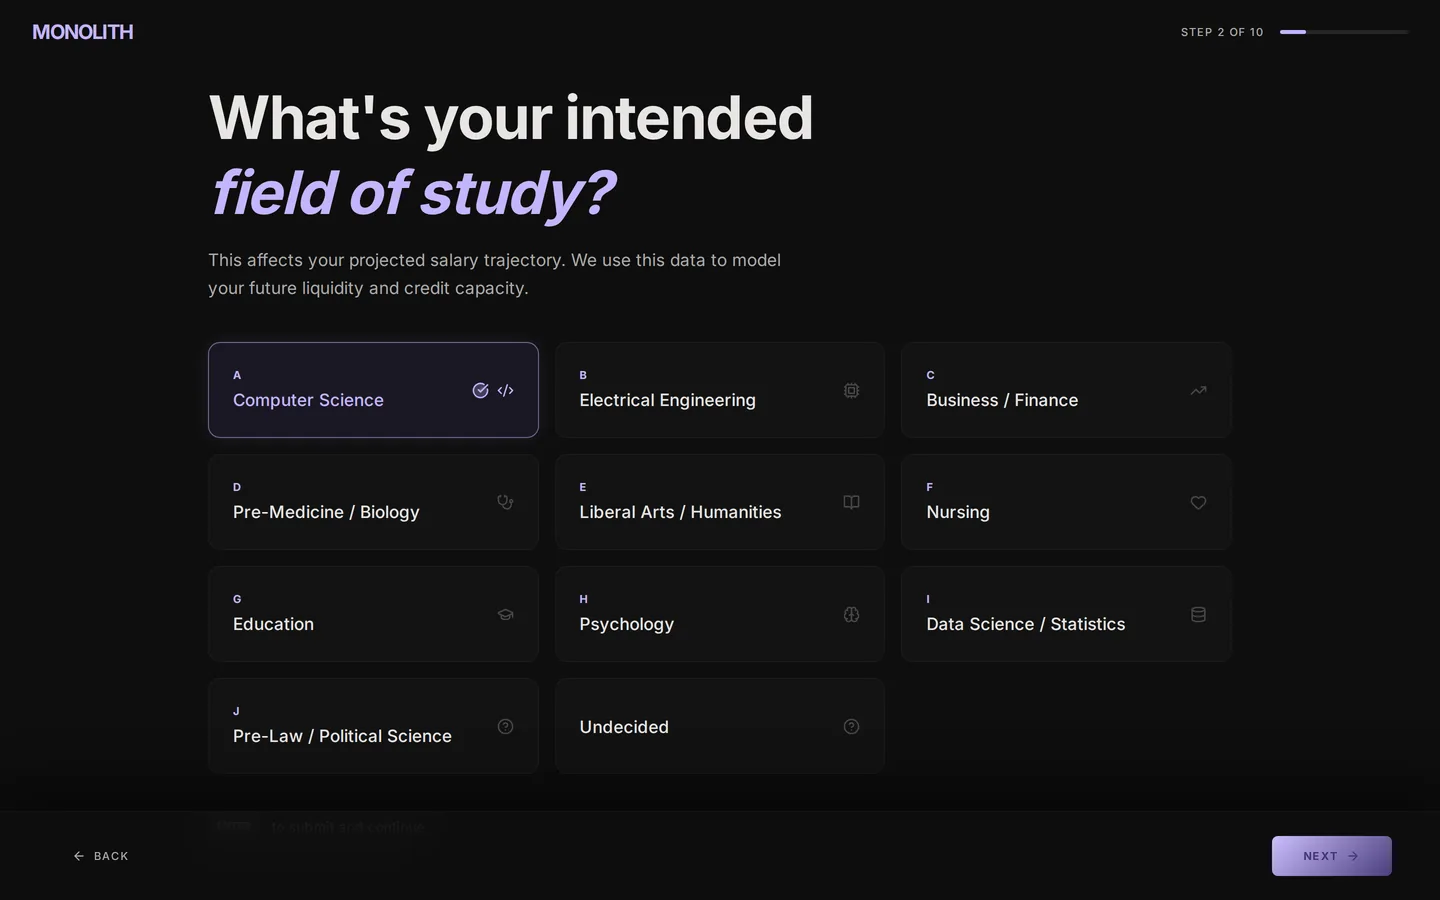
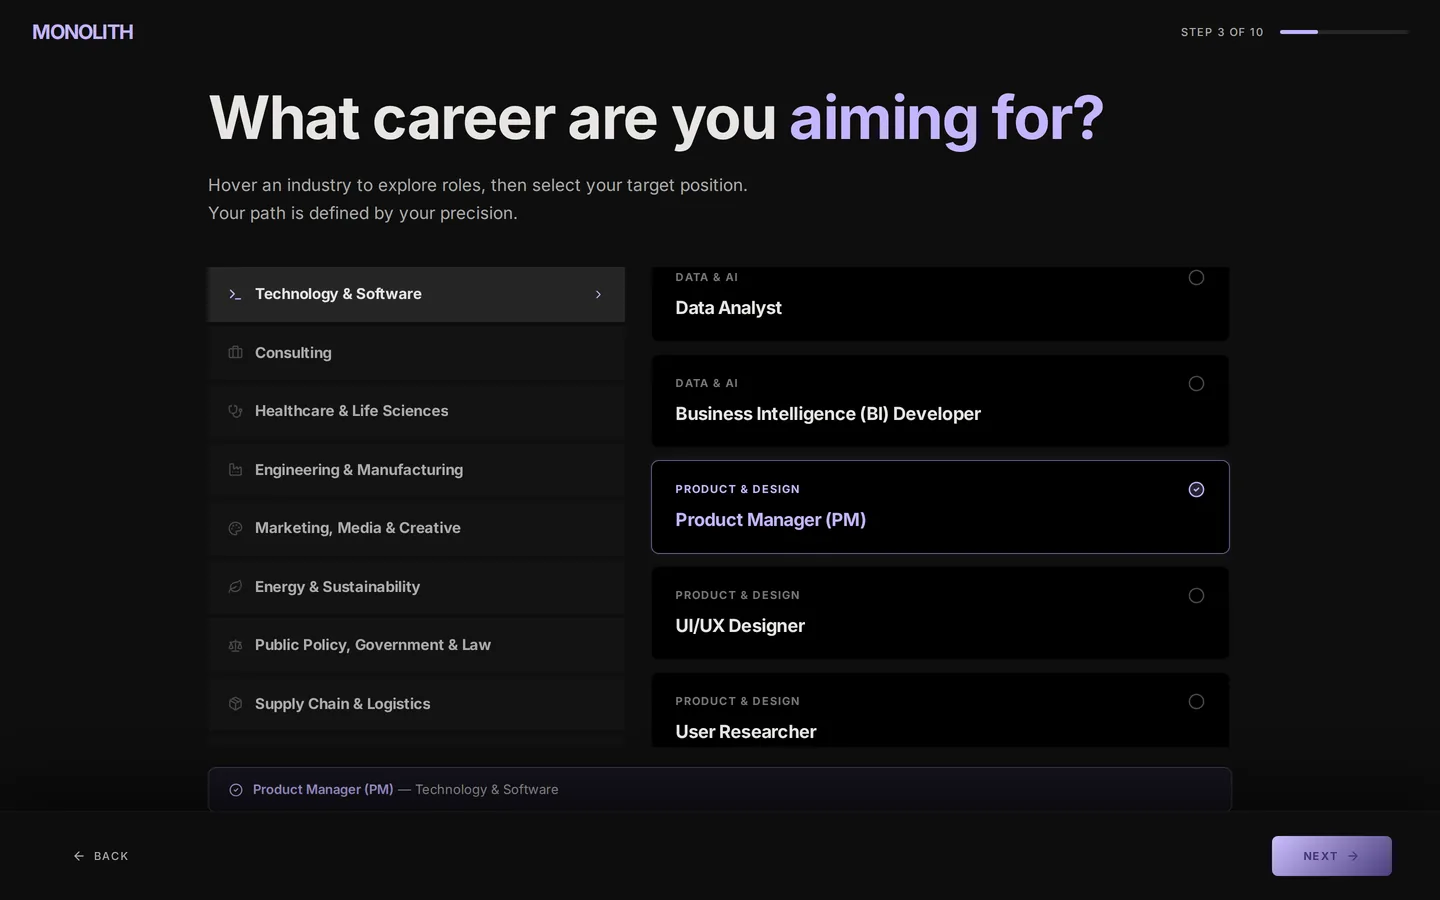
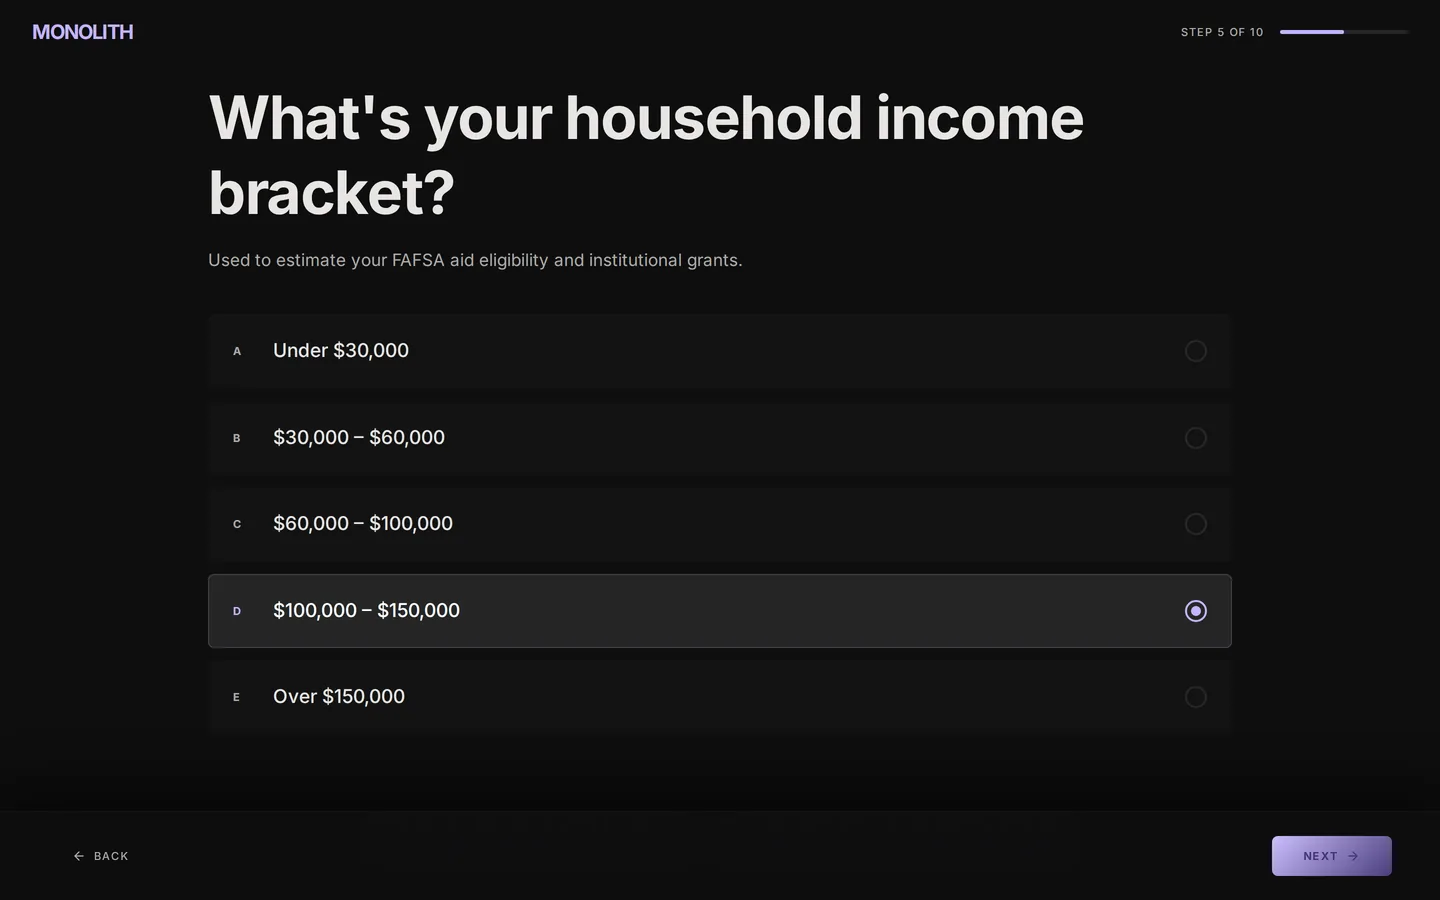
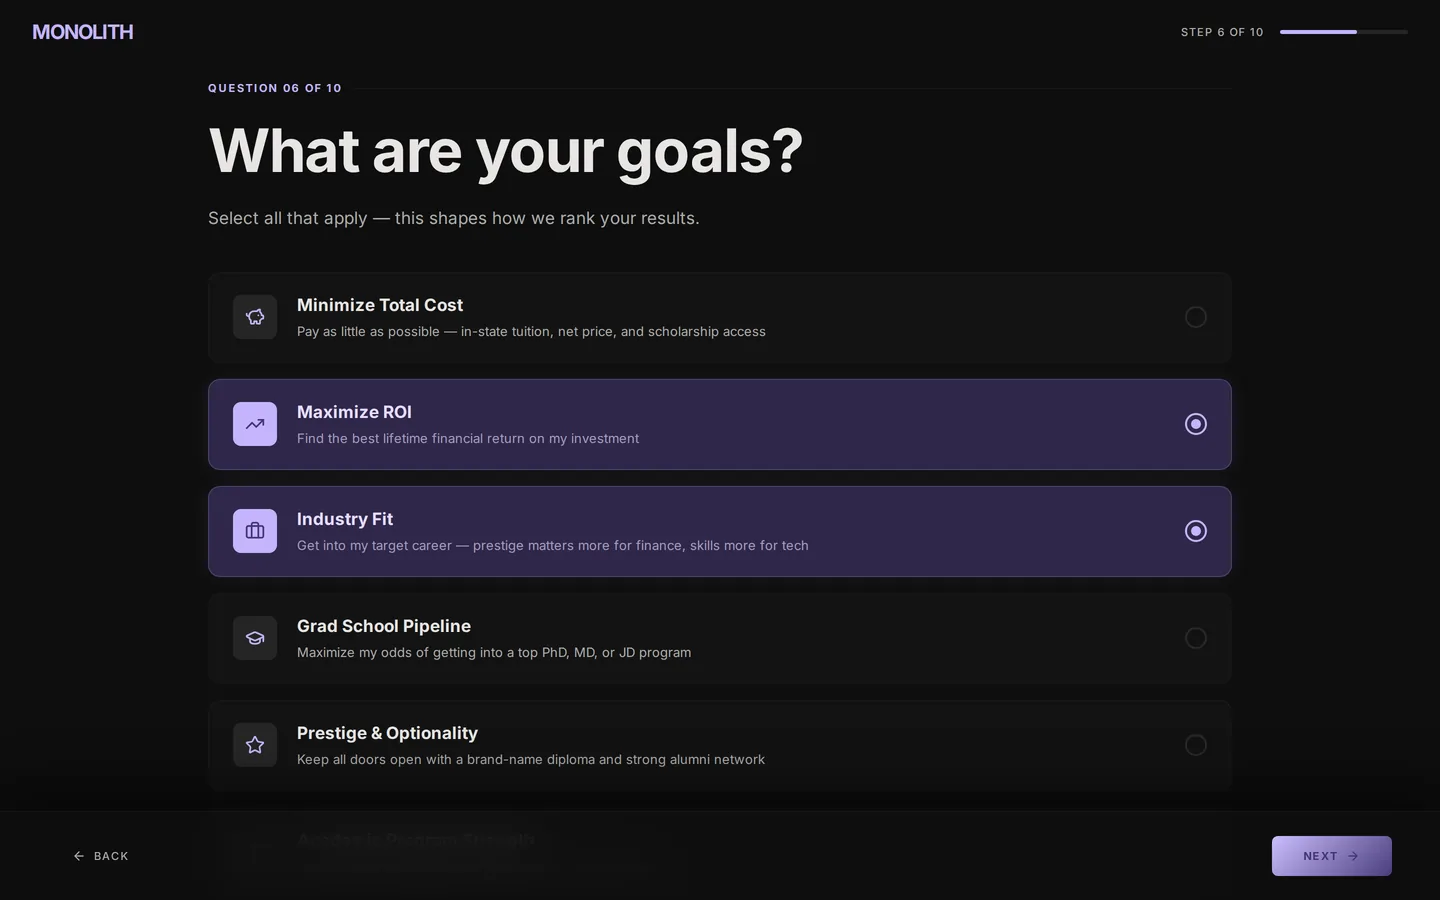
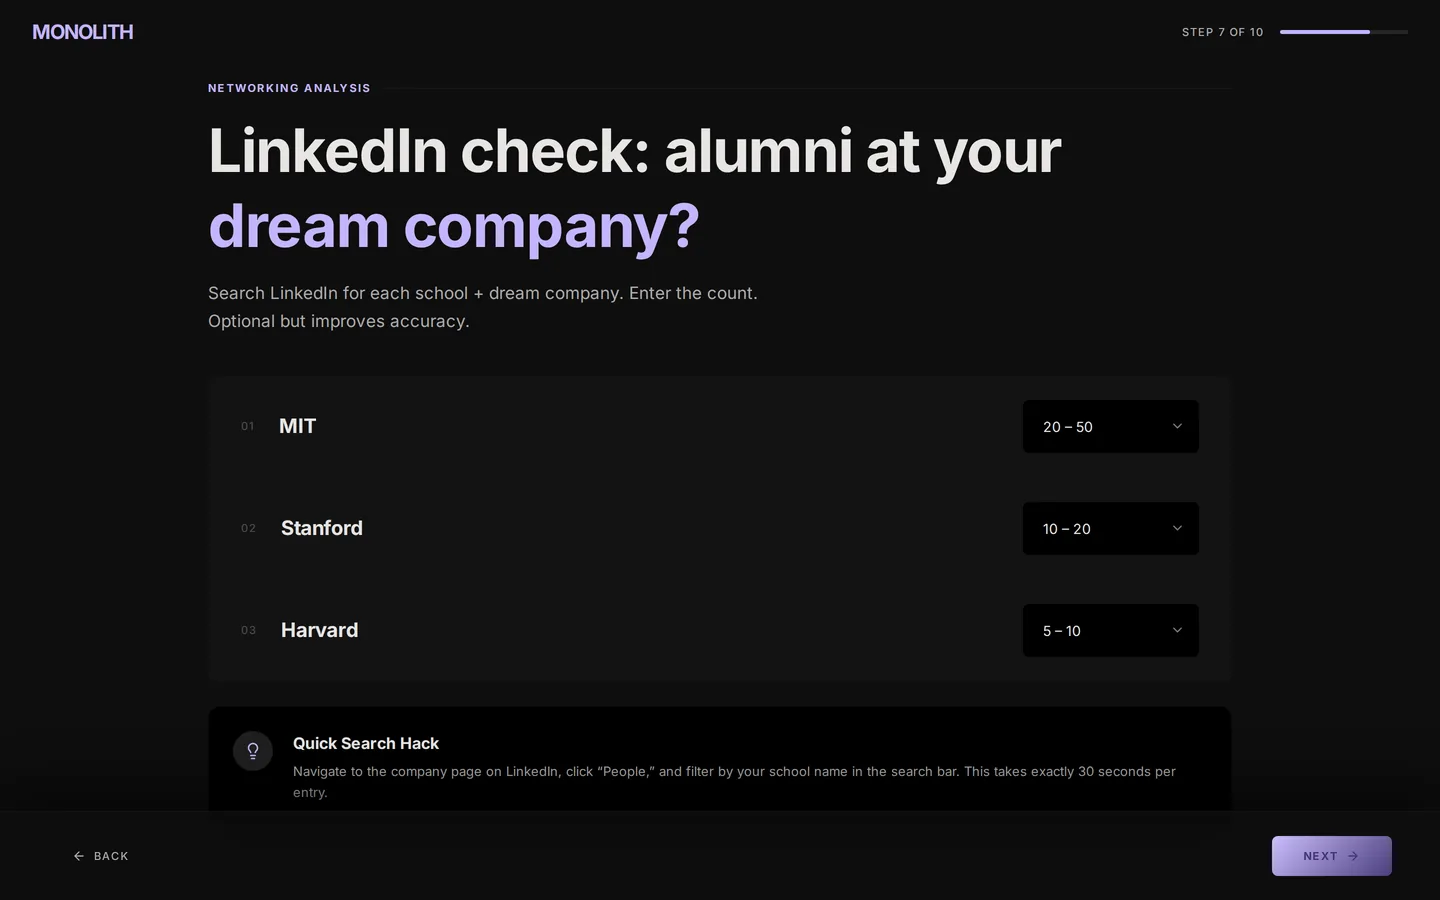
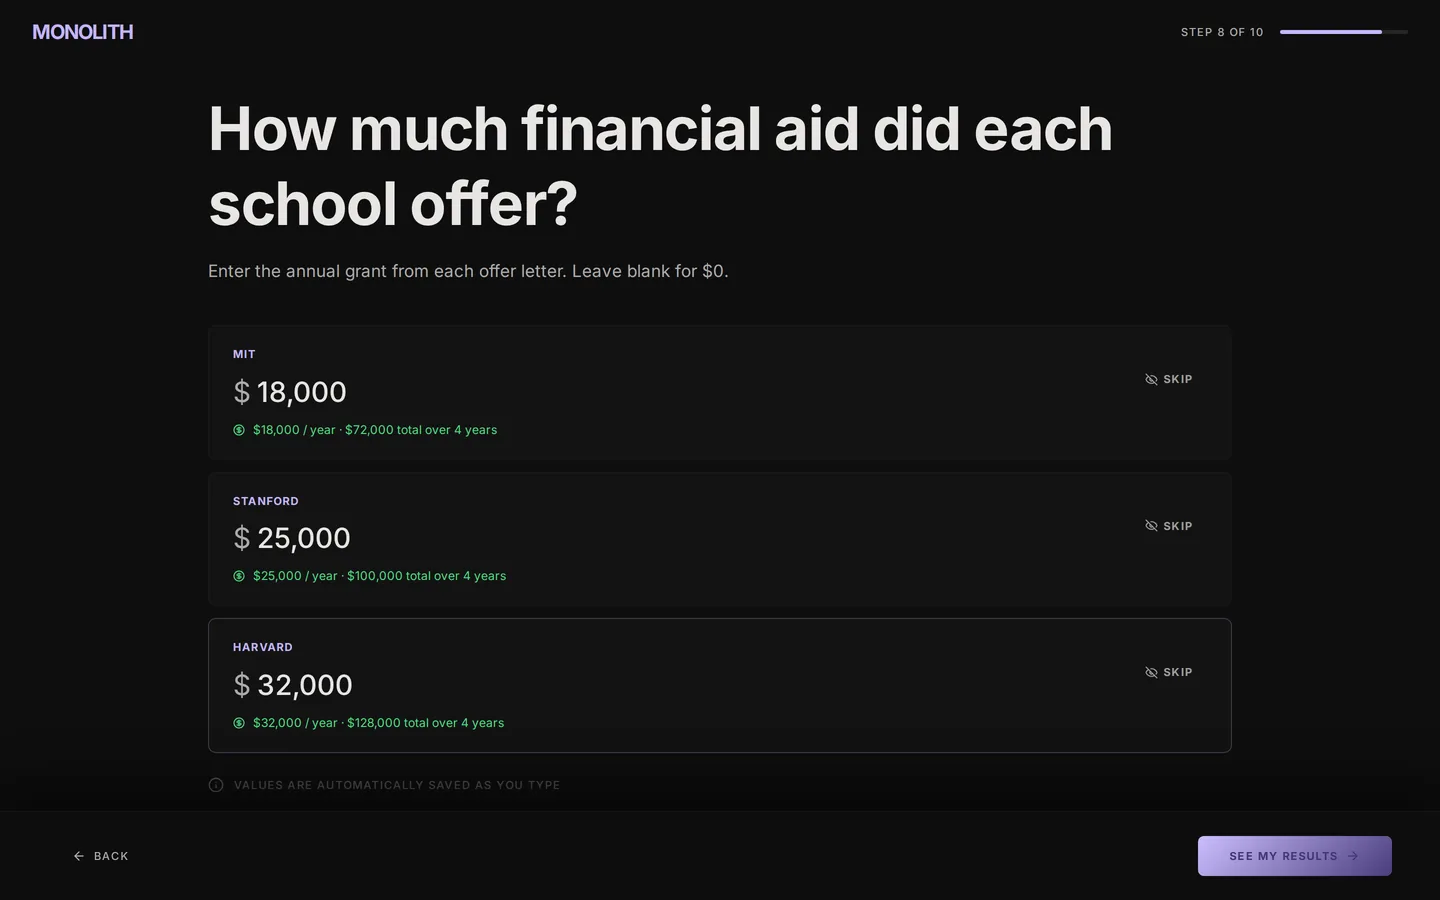
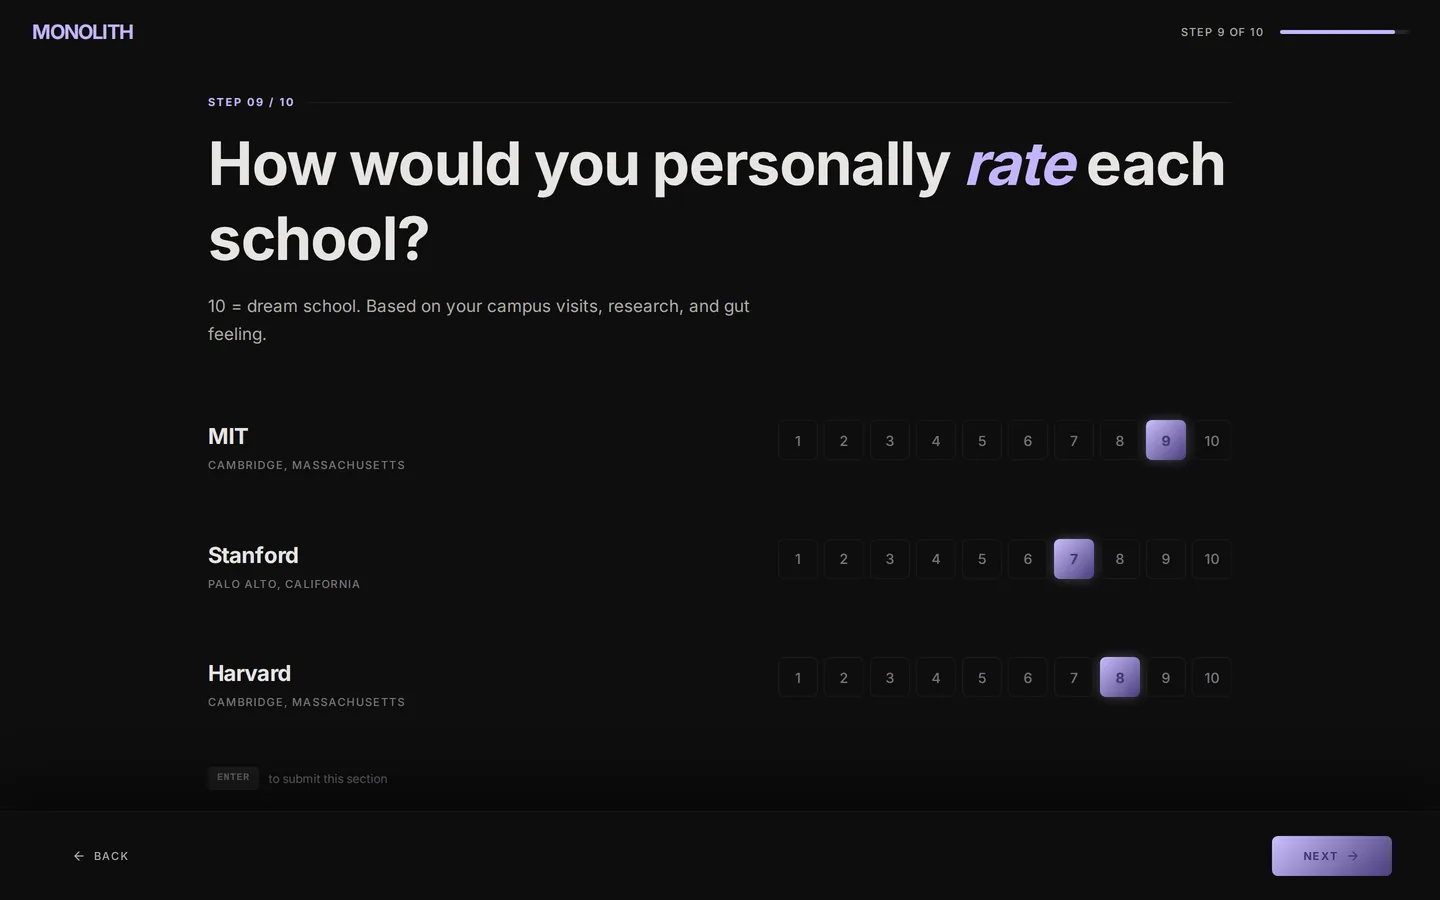
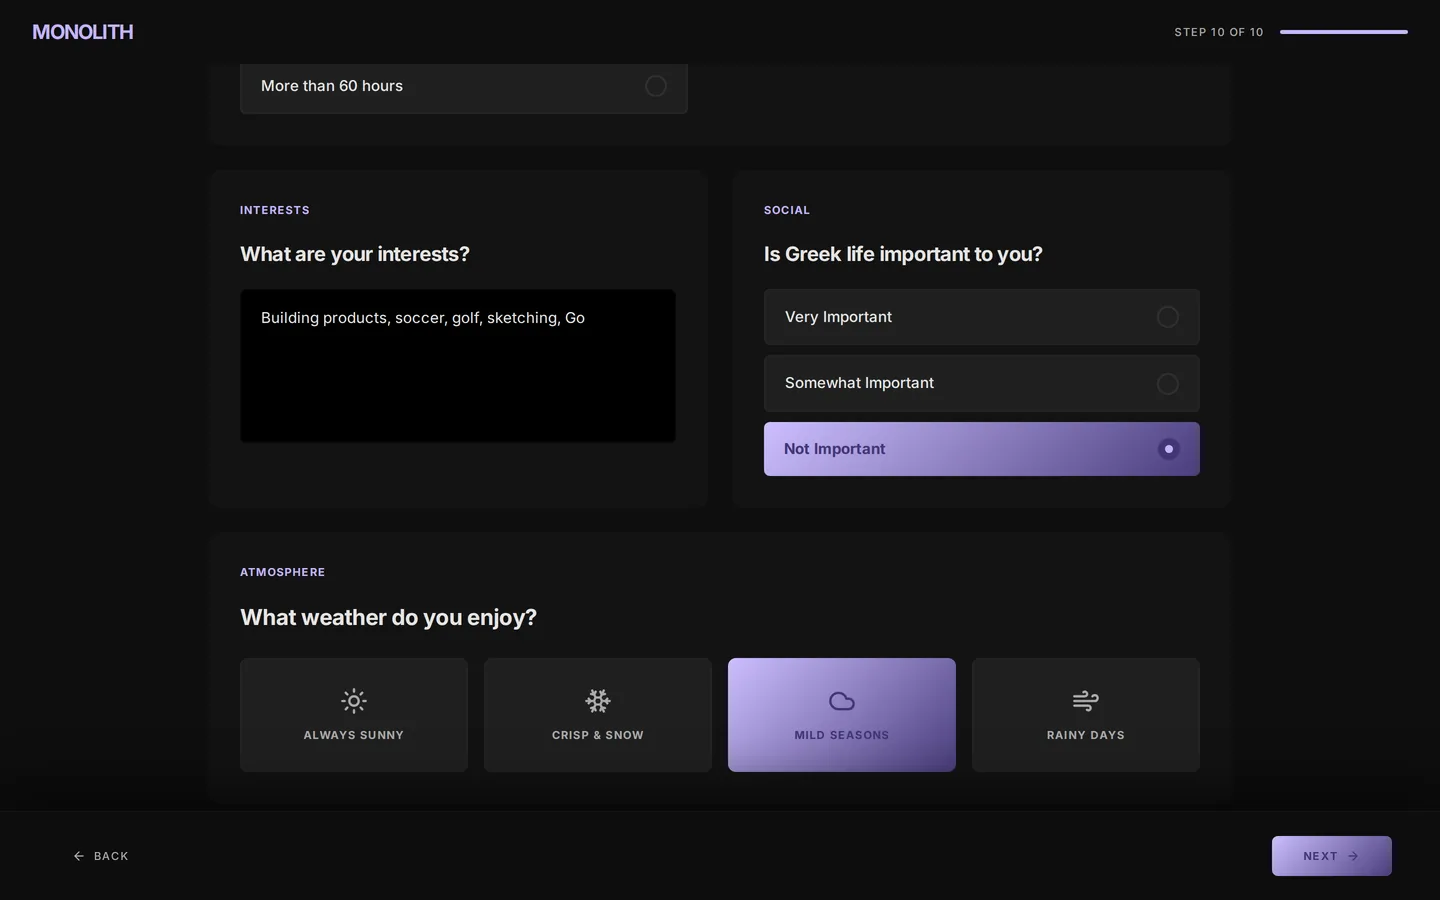
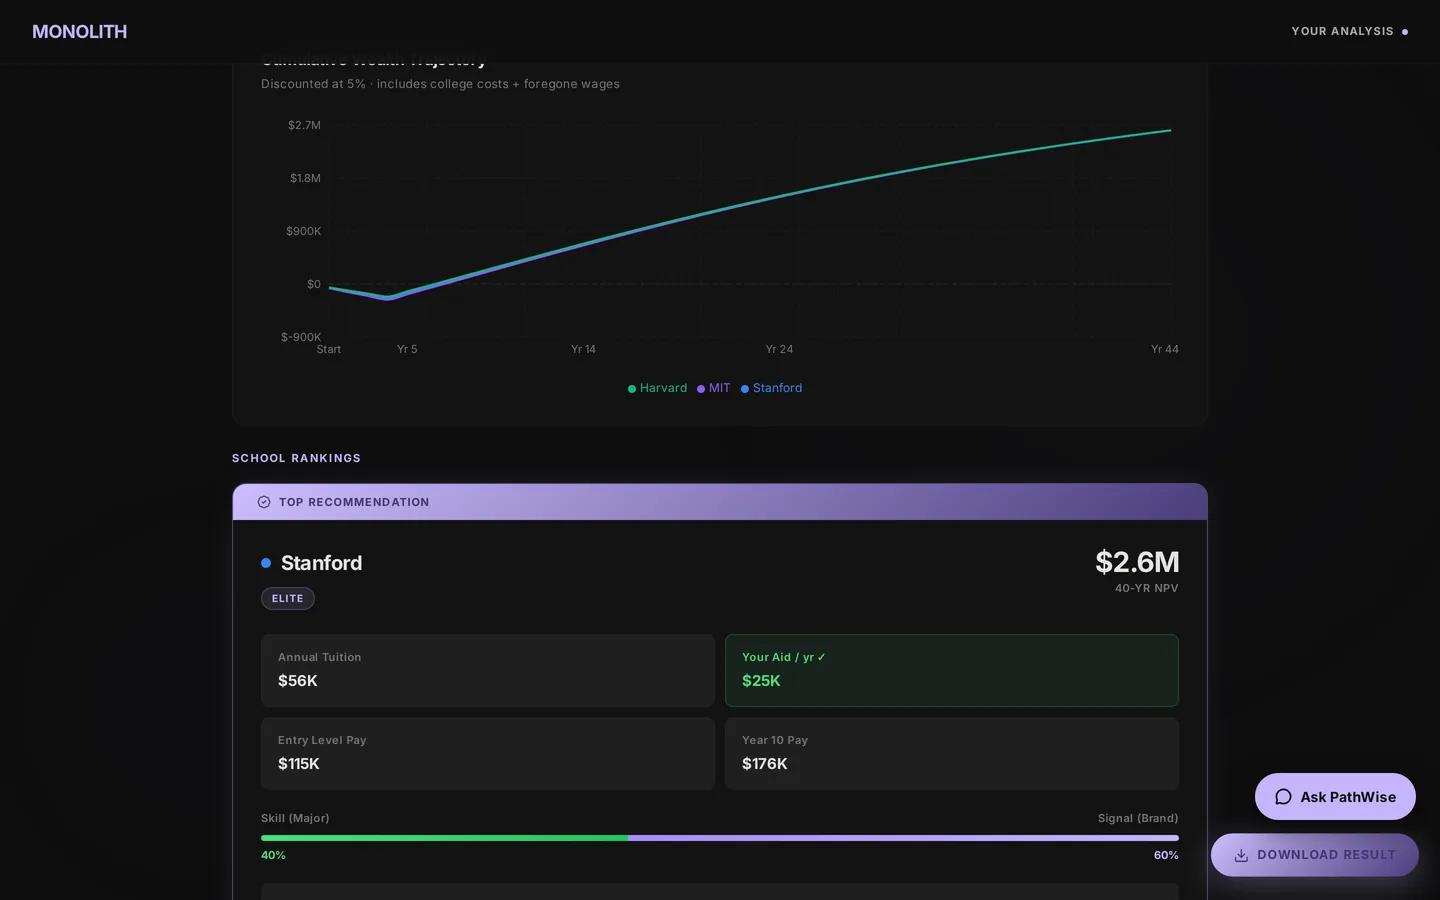
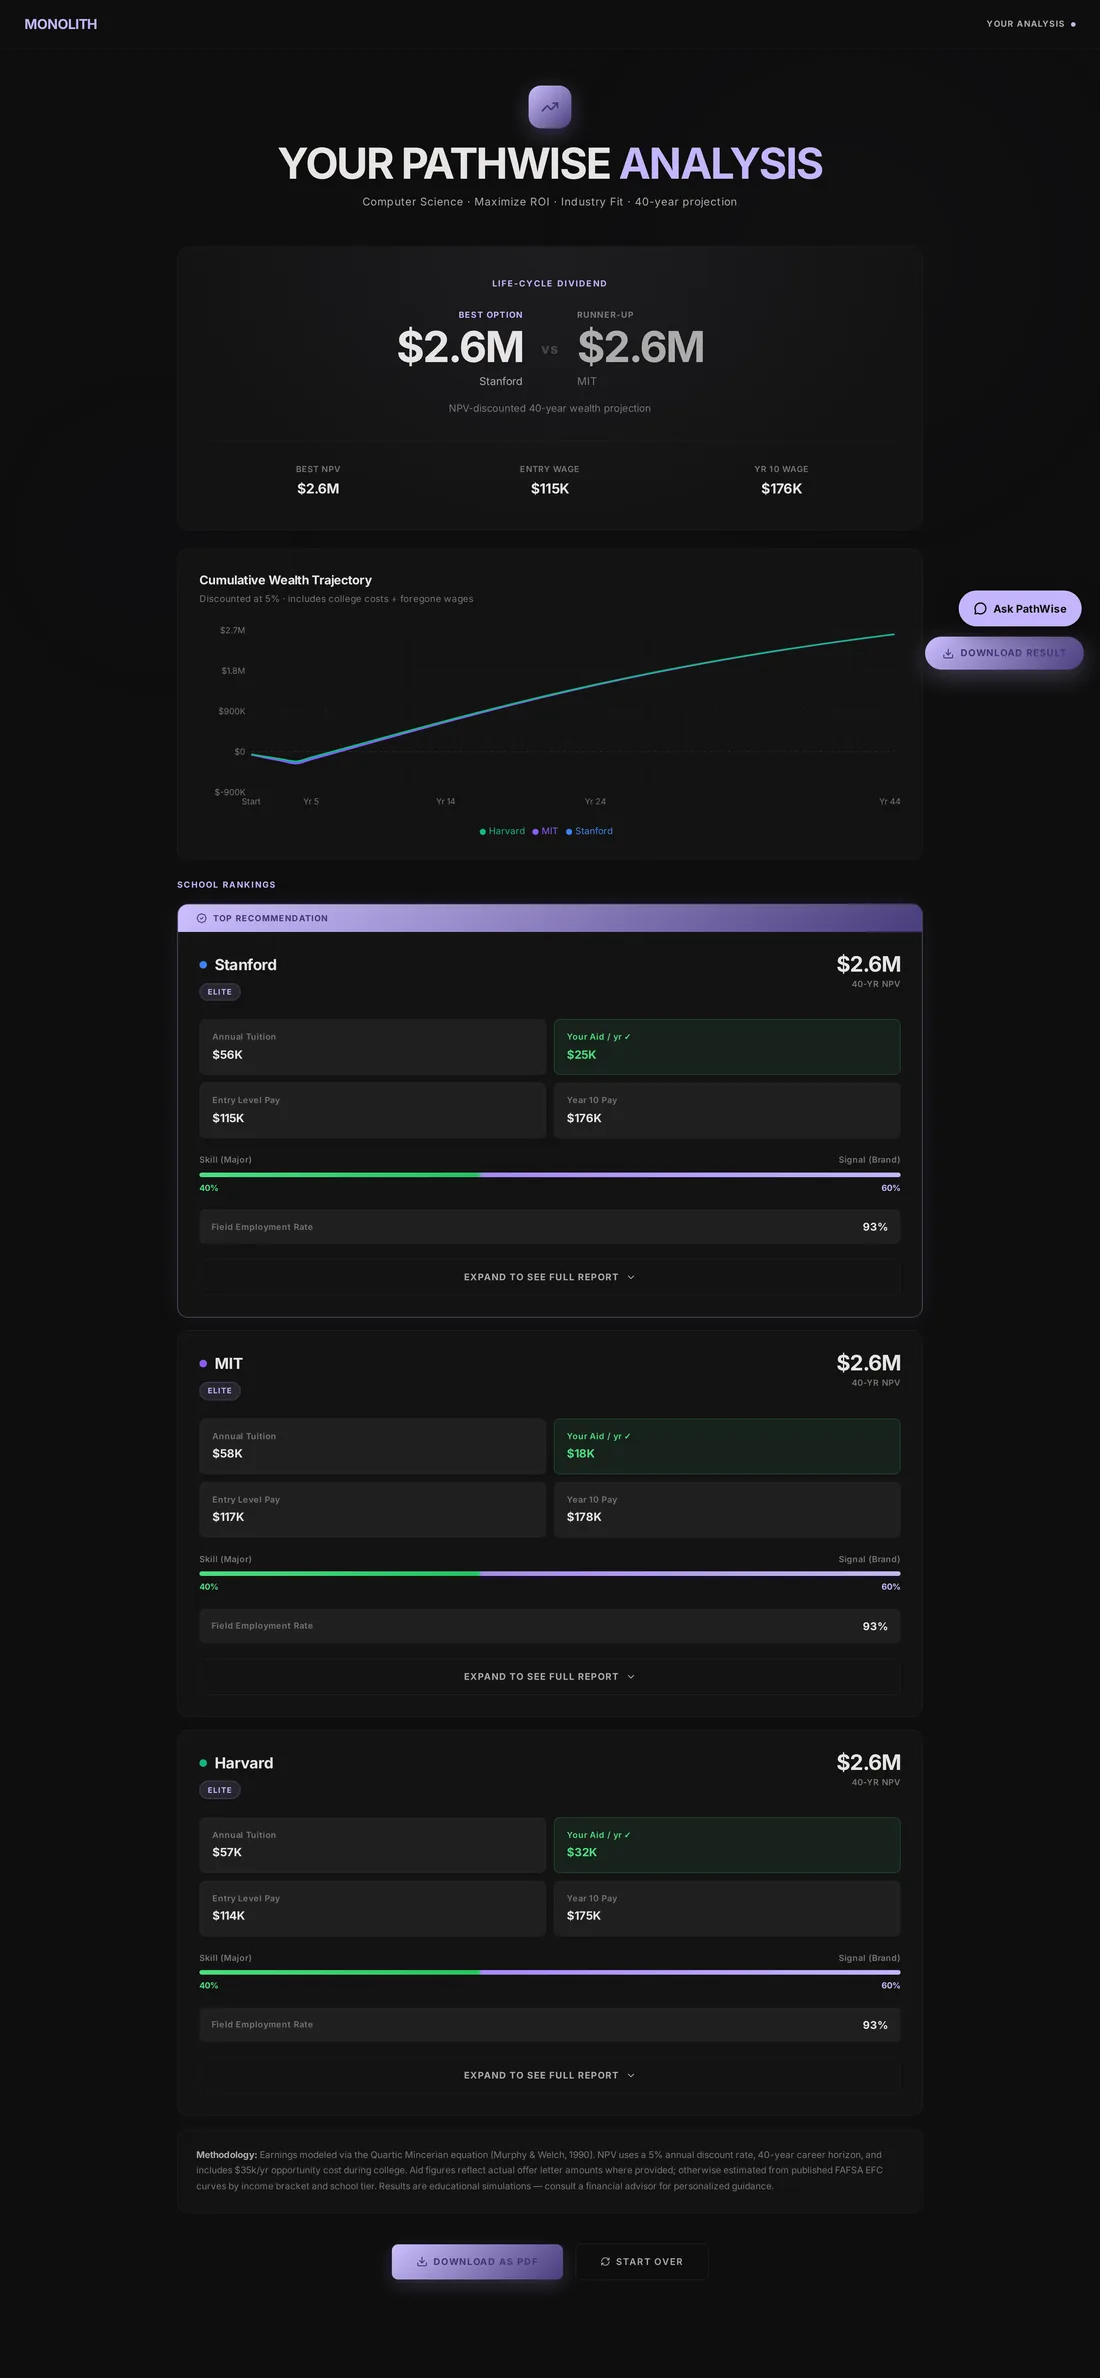
The full report page: verdict, wealth trajectory, ranked schools with tuition, aid, entry and year ten pay, the skill versus signal split, and the methodology note.
Scroll inside the frame. Every number on it comes from the model running in the browser.
What I owned
- Defined the product: who it is for, the ten questions, and what the report has to answer.
- Built the financial model: net price after aid, wage curves by major and role, a 40 year NPV at a 5% discount rate with opportunity cost during college.
- Designed and shipped the interface: the intake flow, the report, the wealth trajectory chart, the narrative and the chat.
- Deployed the live prototype and kept it running as the reference build.
What had to be true
- Ten questions maximum. Every added question loses people before the report.
- The report has to stand without the AI. Fit scores, narrative and chat are layers on top of a model that runs in the browser.
- Aid figures come from the student's own letters when they have them, and from published FAFSA curves by income bracket and school tier when they do not.
- Results are educational simulations, and the page says so.
Ask for the letters, not the rankings
The first question is which schools made an offer, not which schools the student likes. Real offers plus real aid amounts are the only inputs that make the output personal rather than a league table.
Separate skill from signal
A computer science degree pays because of the skill; a finance job pays partly because of the brand on the diploma. The model weights the two per major and shows the split on every school card, so the student sees why a school ranks where it does.
Make the money visible over time
A single dollar figure is easy to dismiss. The cumulative wealth trajectory shows the dip during college, the crossover, and the gap between schools opening or closing over 40 years.
Let the AI explain, not decide
The verdict comes from the model. The narrative and the chat exist to explain the verdict in plain language and answer follow ups, and the report still renders if either of them is unavailable.
What shipped
- A ten step intake: offers, major, industry and role, residency, income bracket, goals, alumni network, aid per school, personal ratings, priorities.
- A report with best option versus runner up, best NPV, entry and year ten wage, a cumulative wealth chart, and ranked school cards.
- Per school detail: annual tuition, the student's own aid, entry and year ten pay, the skill versus signal split, and field employment rate.
- Ask PathWise, a chat that answers questions about the report, plus download as PDF and sharing.
How it was built
- React and Vite single page app, Framer Motion for the flow, Recharts for the trajectory chart.
- Financial model runs client side: Mincerian wage curves, 5% discount rate, 40 year horizon, $35K per year opportunity cost during college.
- Serverless endpoints for the fit score, the narrative and the streaming chat, each with a timeout and a graceful fallback.
- Sessions saved anonymously so a report can be reopened and shared.
Trade offs I made on purpose
- Dark, quiet interface with one question per screen. The subject is stressful enough.
- Keyboard first: letters select options, Enter continues.
- Optional questions stay optional. Skipping alumni counts or aid does not block the report.
- The methodology is printed at the bottom of every report.
Takeaways
- Asking for the student's real numbers is the whole product. Generic inputs produce a generic ranking anyone could look up.
- Showing the model's reasoning, the skill versus signal split and the methodology, earns more trust than a confident verdict.
- The AI layers are most valuable as explanation. The decision has to come from arithmetic the student can inspect.